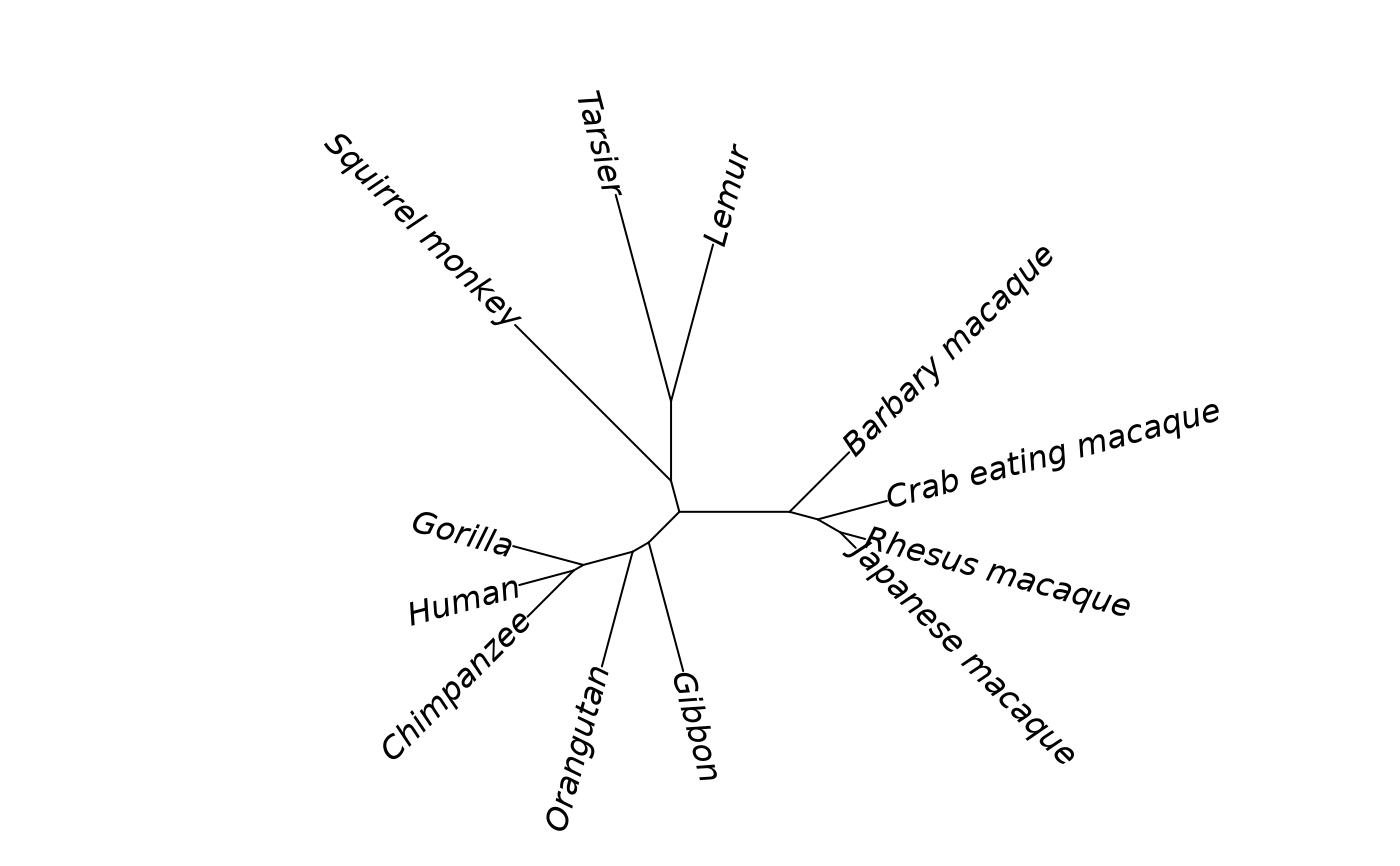
Distance matrix of 12 primate species based on mitochondrial DNA sequences. This classic dataset from Hayasaka et al. (1988) shows nucleotide substitutions per site and is frequently used in phylogenetics education.
Format
A dist object with 12 taxa:
- Human
Homo sapiens (great ape)
- Chimpanzee
Pan troglodytes (great ape)
- Gorilla
Gorilla gorilla (great ape)
- Orangutan
Pongo pygmaeus (great ape)
- Gibbon
Hylobates lar (lesser ape)
- Japanese_macaque
Macaca fuscata (Old World monkey)
- Rhesus_macaque
Macaca mulatta (Old World monkey)
- Crab_eating_macaque
Macaca fascicularis (Old World monkey)
- Barbary_macaque
Macaca sylvanus (Old World monkey)
- Squirrel_monkey
Saimiri sciureus (New World monkey)
- Tarsier
Tarsius syrichta (prosimian)
- Lemur
Lemur catta (prosimian)
Source
Table 4 from Hayasaka K, Gojobori T, Horai S (1988). "Molecular phylogeny and evolution of primate mitochondrial DNA." Molecular Biology and Evolution, 5(6), 626-644. doi:10.1093/oxfordjournals.molbev.a040524
Details
Values represent the number of nucleotide substitutions per site between species, computed from mitochondrial DNA sequences. The phylogenetic pattern shows great apes clustering together, macaques forming a tight group, and prosimians (Tarsier, Lemur) as outgroups.
References
Hayasaka K, Gojobori T, Horai S (1988). "Molecular phylogeny and evolution of primate mitochondrial DNA." Molecular Biology and Evolution, 5(6), 626-644. doi:10.1093/oxfordjournals.molbev.a040524